



Your localization metrics (might) look great. But does anyone actually understand them?
We've all heard the 'you can't improve what you don't measure' bit. It comes up in meeting rooms, in leadership presentations, and, of course, in the conversation around localization. I agree with that principle. If you don't measure it, then you don't know if you're actually making any progress at all.
But if you've ever had to build a Localization dashboard or put together a QBR, then you'll know how much of an exercise it can be to work out what to measure. Do we measure translation volumes, delivery times, quality scores, or maybe cost savings? And of those metrics, which ones actually go on to explain the contribution of Localization to the business?
We've spent a long time talking about how to get beyond the so-called vanity metrics and start measuring things that are actually more closely linked to business outcomes. That's a debate I think is very much worth having, and there's still a long way to go in that regard.
Lately, though, I've been wondering whether we're only solving half the problem. We can spend weeks choosing our KPIs, collecting data, and building a beautiful dashboard, only to present it to people who don't really know what to make of the numbers.
Once we've established what we're going to measure we then have the job of helping our stakeholders to understand what we've measured.
Choosing the right metrics is only half the job. Can you picture 150,000 words?
Let's take one of our industry's favorite metrics: translated words. You tell senior leadership that your team localized 150,000 words last quarter. For someone who works in Localization, that figure probably means something.
But would a colleague in Finance or Marketing have any idea how much content that represents?
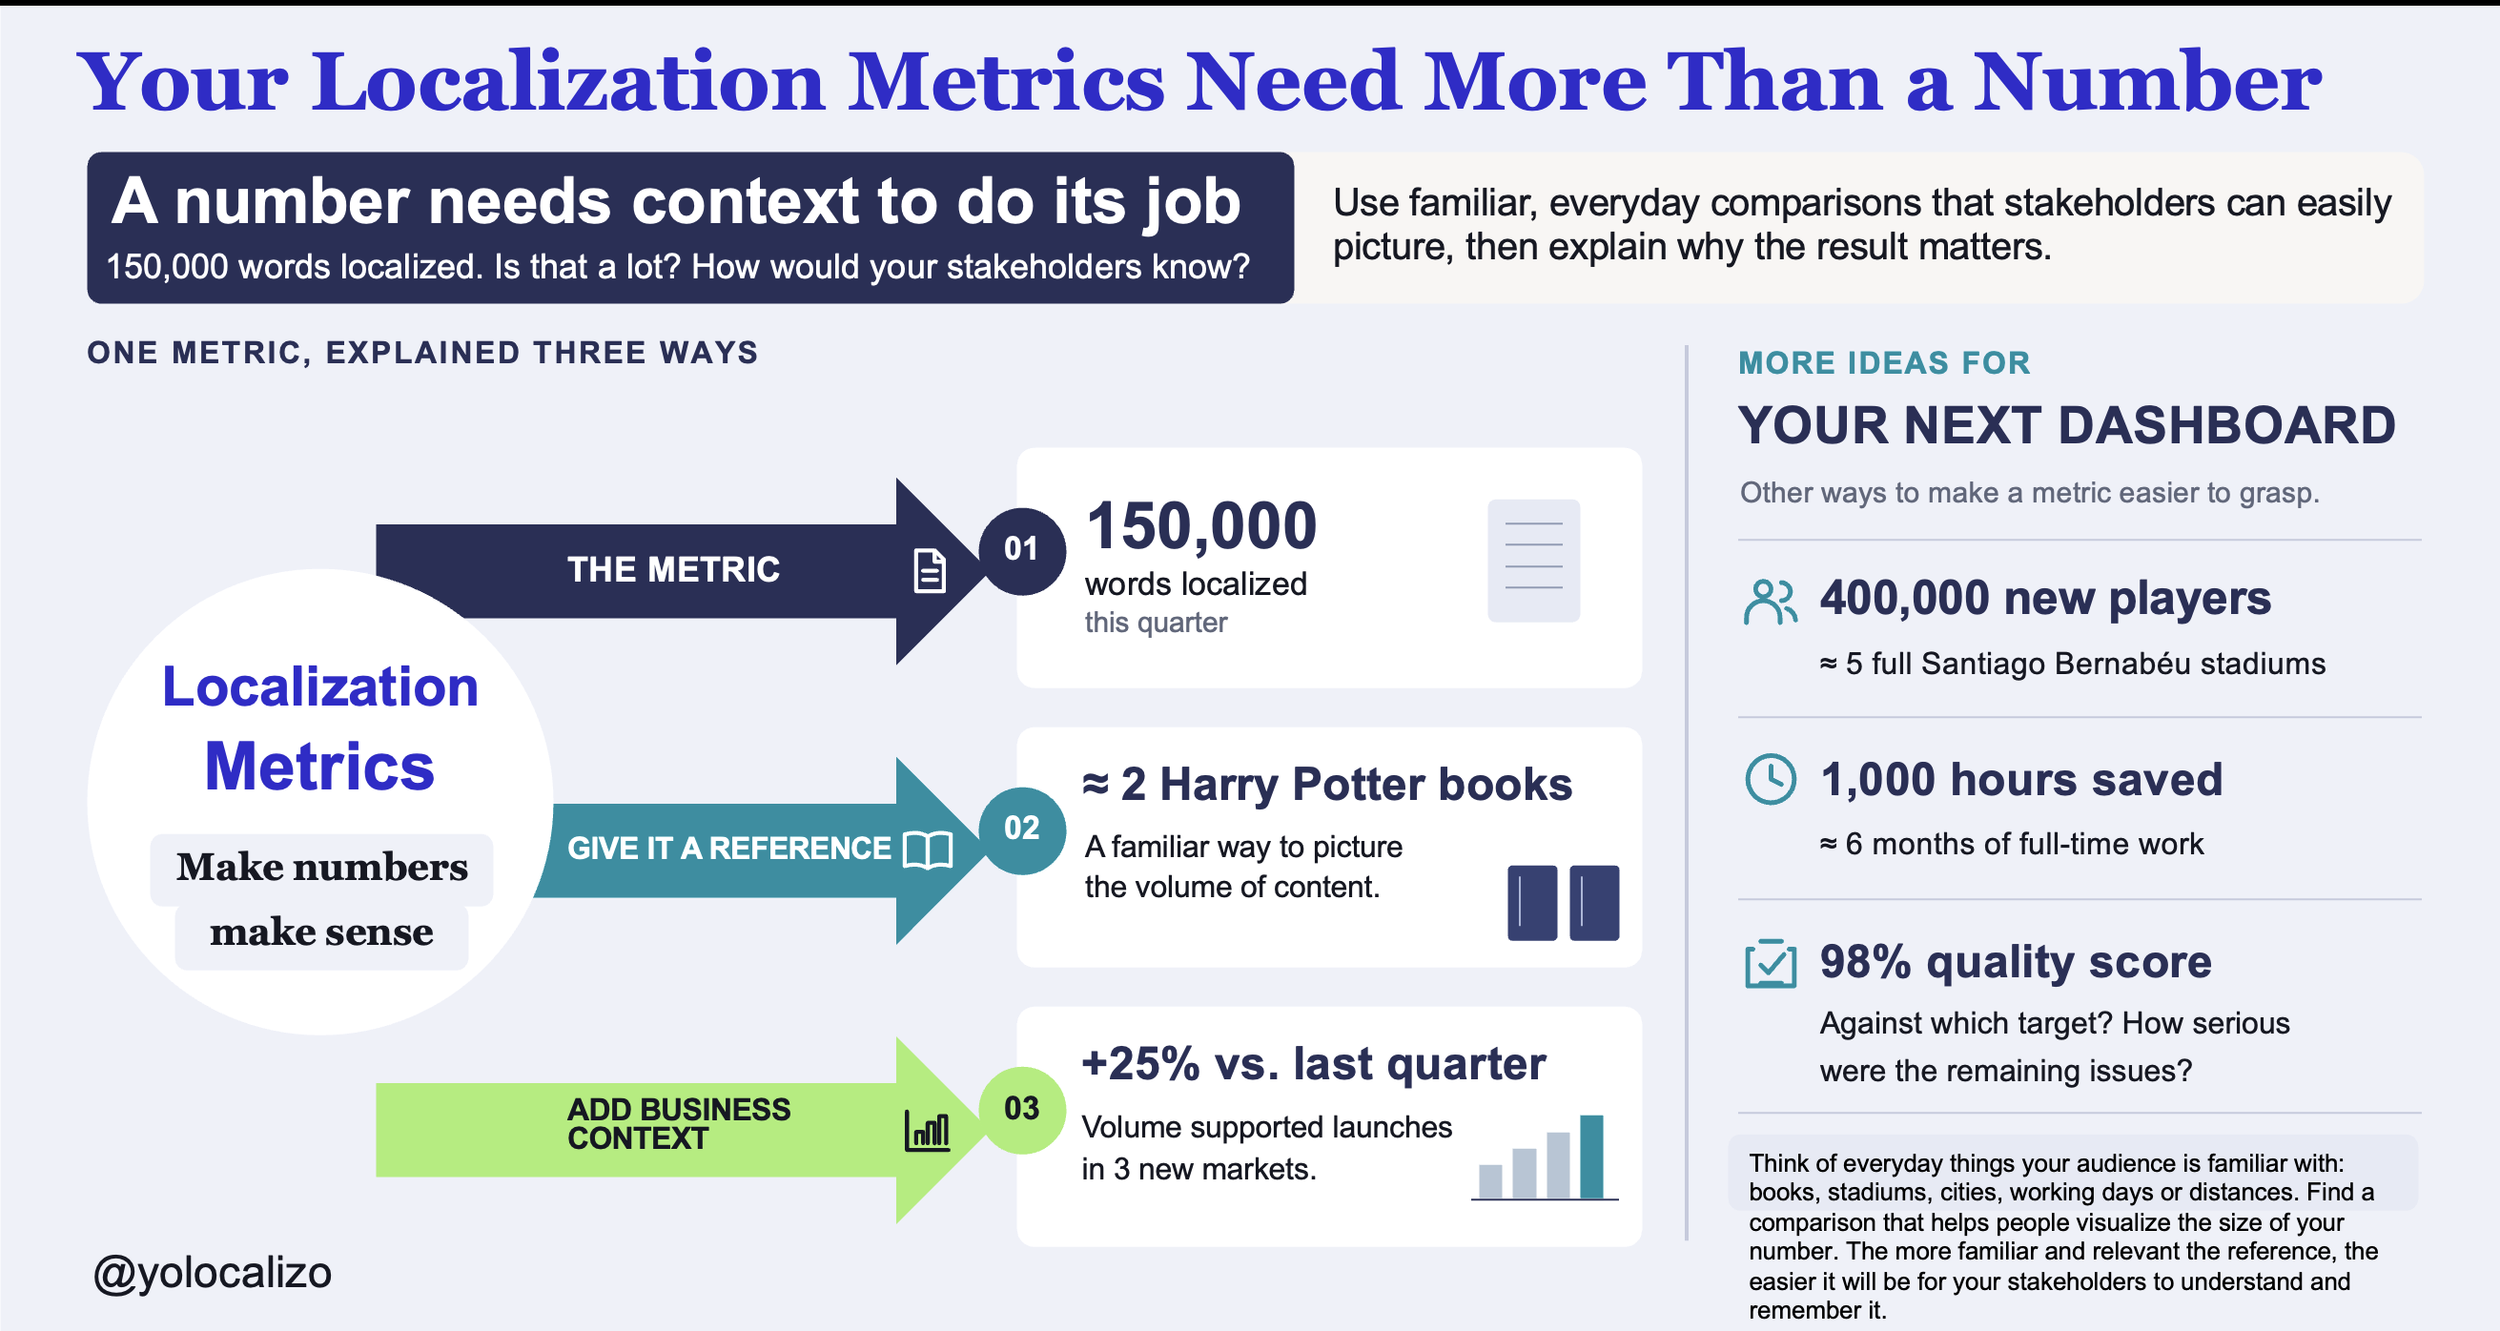
The first Harry Potter book contains around 77,000 words. So you could explain that 150,000 words is roughly the equivalent of translating that book twice. Suddenly, we're talking about something people can picture, even if they haven't read the books themselves.
Or take player numbers. Say your game attracted 400,000 new players in a market. That's a big number, but I find it much easier to appreciate when I think of it as enough people to fill the Santiago Bernabéu about five times,
And hey, I'm a Real Madrid fan, so of course I'm going to use the Bernabéu! :)
CLICK HERE TO DOWNLOAD THE INFOGRAPHIC
A lesson from Steve Jobs
Steve Jobs introduced the iPod Nano and wanted people to understand just how small it was. He could have walked through its dimensions and weight on a slide. Instead, he pulled it out of the tiny coin pocket of his jeans.
And as he was pointing to that little pocket, he asked the audience, "Have you ever wondered what that pocket is for?" and then, of course, revealed the Nano and said, "Well, now we know."
I really like this example, as in a matter of seconds, Jobs explained something that would probably have taken several slides of specs. You could immediately see how small the thing was.
I think we could do something analogous to our reports. If a new workflow saves 1,000 hours of work, that's about 6 months of full-time work for one person. It's a way of giving a fairly abstract efficiency figure some tangible scale.
A memorable number still needs context
There's a caveat with all of these examples. Saying that 150,000 words is equivalent to two Harry Potter books will give you a sense of the volume, but does that in any way tell you whether the team had a good quarter? Not really.
Maybe those 150k words represented a 25% increase as the business was launching into three new markets. Alternatively, the volume may have been less than expected as a major release had been delayed. The same figure would have been the subject of very different conversations.
Quality scores can be just as tricky. A dashboard might show 98% localization quality, which sounds reassuring until someone asks what the percentage actually measures. Were the issues minor punctuation problems, or did they include a bug that stopped players from progressing? Was the target 95% or 99%? Without that information, it's surprisingly easy to draw the wrong conclusion from a perfectly accurate metric.
So for me there are two useful things we can do when reporting performance. We can make a number more tangible and we can provide the context that makes it meaningful. The Harry Potter comparison is useful for the first. The quarterly trend, the business objective and the quality of the outcome are all useful in providing the context for the second.
And of course neither should that be an excuse to make a fairly ordinary result sound any more impressive than it is.
Who's looking at the dashboard?
It's also important to remember that different stakeholders will be looking at our reports with different questions in mind. A 30% increase in localisation volume might be of interest to Finance in terms of spend, whereas a Product Director will be asking which of the releases the extra content has been used to support. Within our own team we'll be looking at it in terms of workload, vendor capacity and turnaround times.
I don't think we need a whole different set of numbers for every audience (though I suppose we might). We do need to think about what the audience is trying to get their head around. The level of detail that is useful to my team in terms of delivery may be completely irrelevant in a leadership meeting. The opposite may be true though. The sort of detail that explains what changed and what it means for the next launch could be precisely what the leadership team are after.
Final thoughts
Before your next quarterly review, try it the next time you're working on a Localization dashboard. Pick one key metric and show it to someone who's not in our world. Ask them what they make of it. You might be quite surprised by the answer.
Could a well known analogy help them understand the scale? Are you presenting a trend or a target so they can assess the outcome? Have you made it clear as to why the figure is important to the business and what it might be indicative of in terms of a decision?
You might find that the dashboard doesn't need another KPI or a more sophisticated chart. A sentence of context could do more than another page of data.
I still believe we should keep improving how we measure the impact of Localization. But I also think that the work isn't finished when the numbers appear on a slide.
We often say, "You can't improve what you don't measure." Fair enough. I'd add one more thought: if we want our stakeholders to recognize the value of what we do, we need to help them understand what those measurements mean.
Otherwise we end up with a brilliant dashboard which makes perfect sense to us and very little sense to everyone else. And that would be a massive missed opportunity wouldn't it?
What about you? Have you found a comparison or a simple explanation that helped a stakeholder understand one of your Localization metrics?
Have a great week!
@yolocalizo
A multi-market expansion strategy for any product is most effective if the various Globalization (i.e.Localization, Internationalization) activities are understood as a cycle that runs parallel to the multiple phases of software development; This cycle repeats during the various product upgrades. It is not an activity that is executed as if it were a process once the home market version (usually in English) is finalized. It is not a transaction that simply sends files to a professional localizer shortly before the global release. No; Globalization is not a process. Globalization is a cycle that runs multiple times. It is a cycle that runs in parallel with the product research, design, and development phases.