
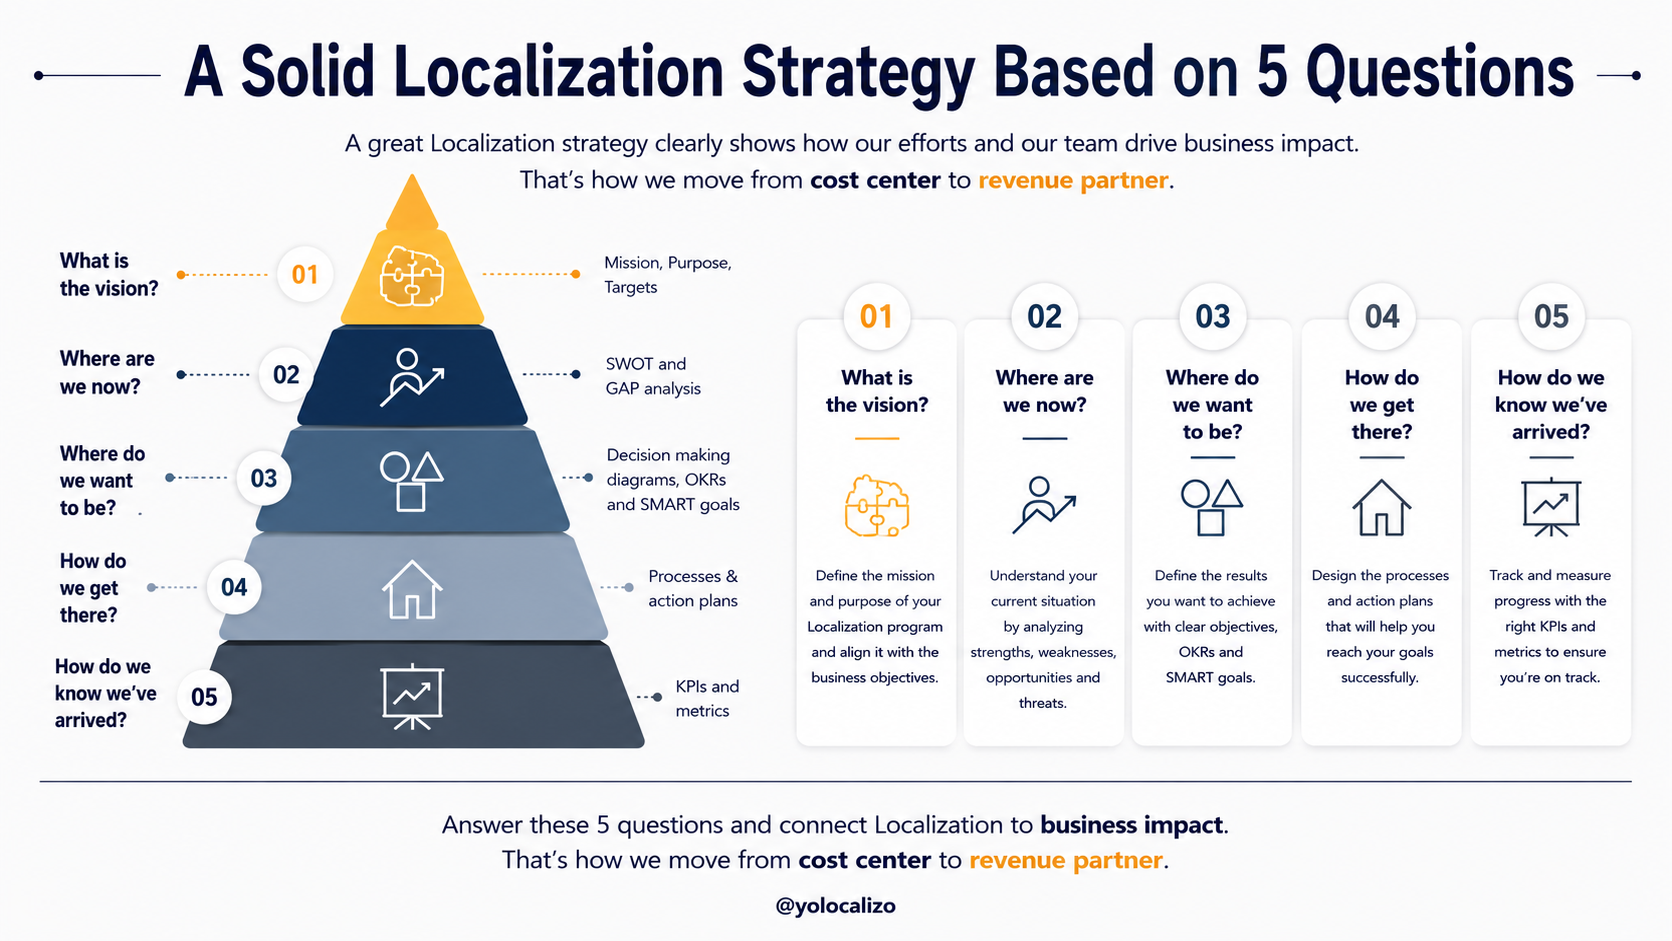


Connecting Localization metrics to business meaning and impact
How to turn localization data into decisions leaders actually care about
A few weeks ago, I had a conversation with a peer from the localization world.
He explained that he was preparing a presentation for the senior leadership team, working on the deck and reviewing his reporting dashboard: edit distance, LQA findings, fuzzy leverage, and the usual metrics Localization metrics we like(or need?) to collect. Then he asked a simple question:
How can I get leadership to care about what we do? They just don’t seem interested in localization.
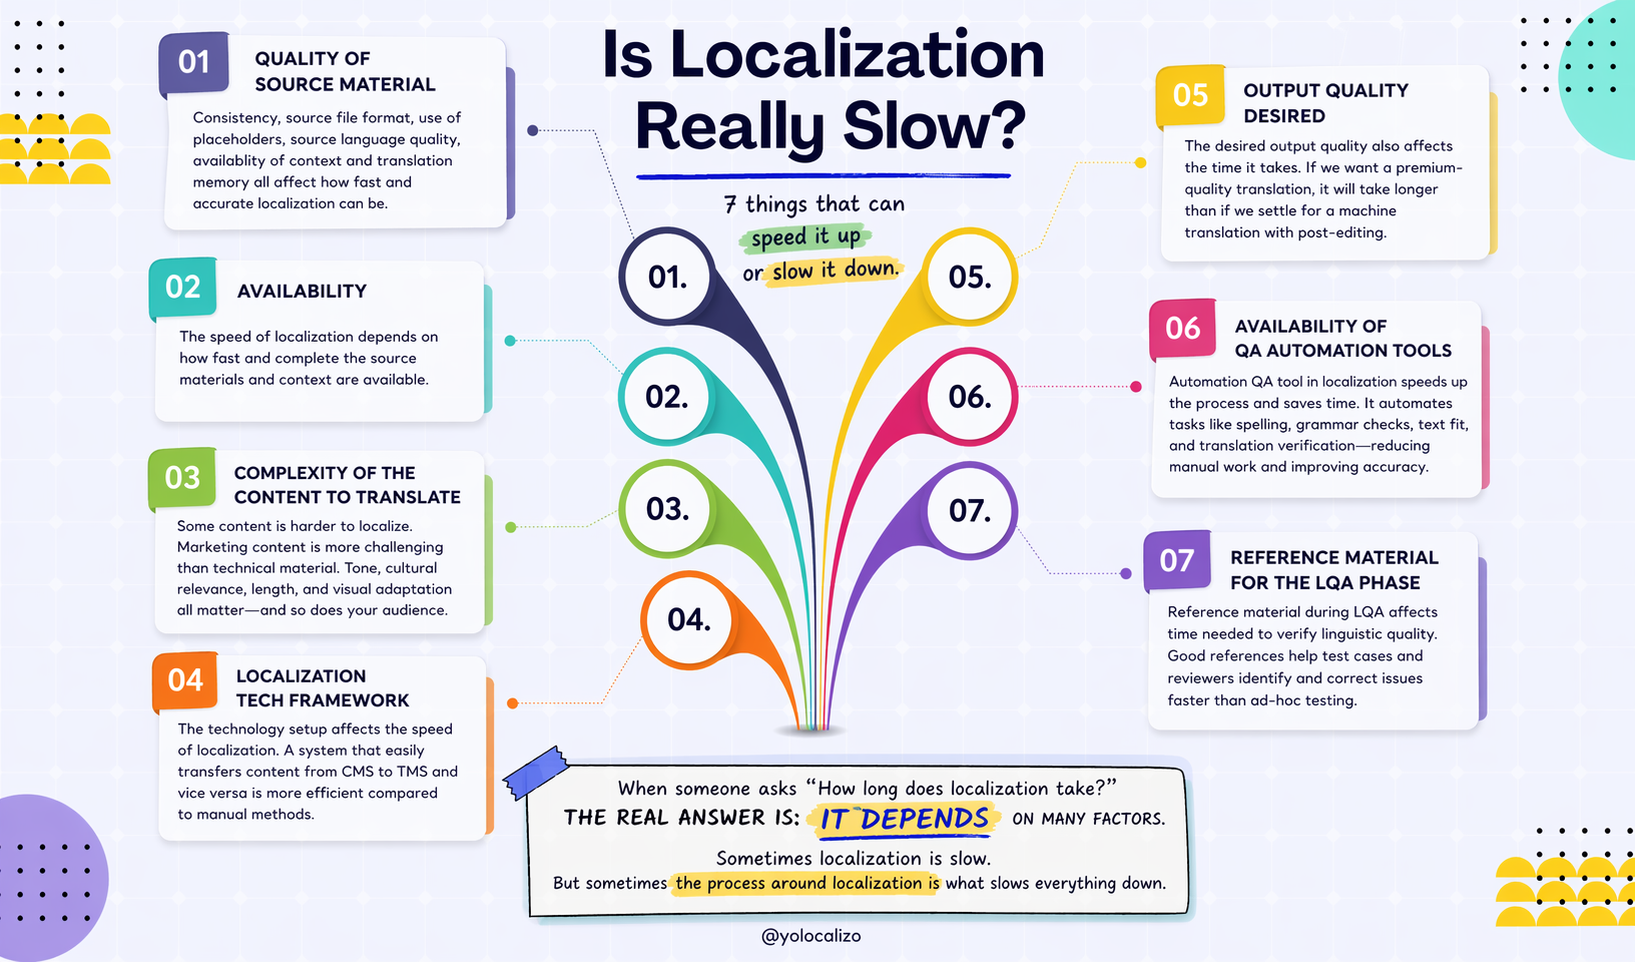
That question sits at the center of many localization conversations I have had during my career. We measure a lot. We present a lot. Yet the story doesn’t always land with leaders who manage budgets and business objectives. This post is a practical answer: a way to connect operational language metrics to business value.
The bridge: how to convert localization metrics into business KPIs
Any operations metric can be linked to quality, time, or cost.
I like to think of it as the classic project management triangle, something I learned years ago while studying for my PMI certification. The concept of the triple constraint, time, quality, and cost, has always stuck with me since then. It explains how every business decision is really a trade-off between those three forces.
That includes localization too.
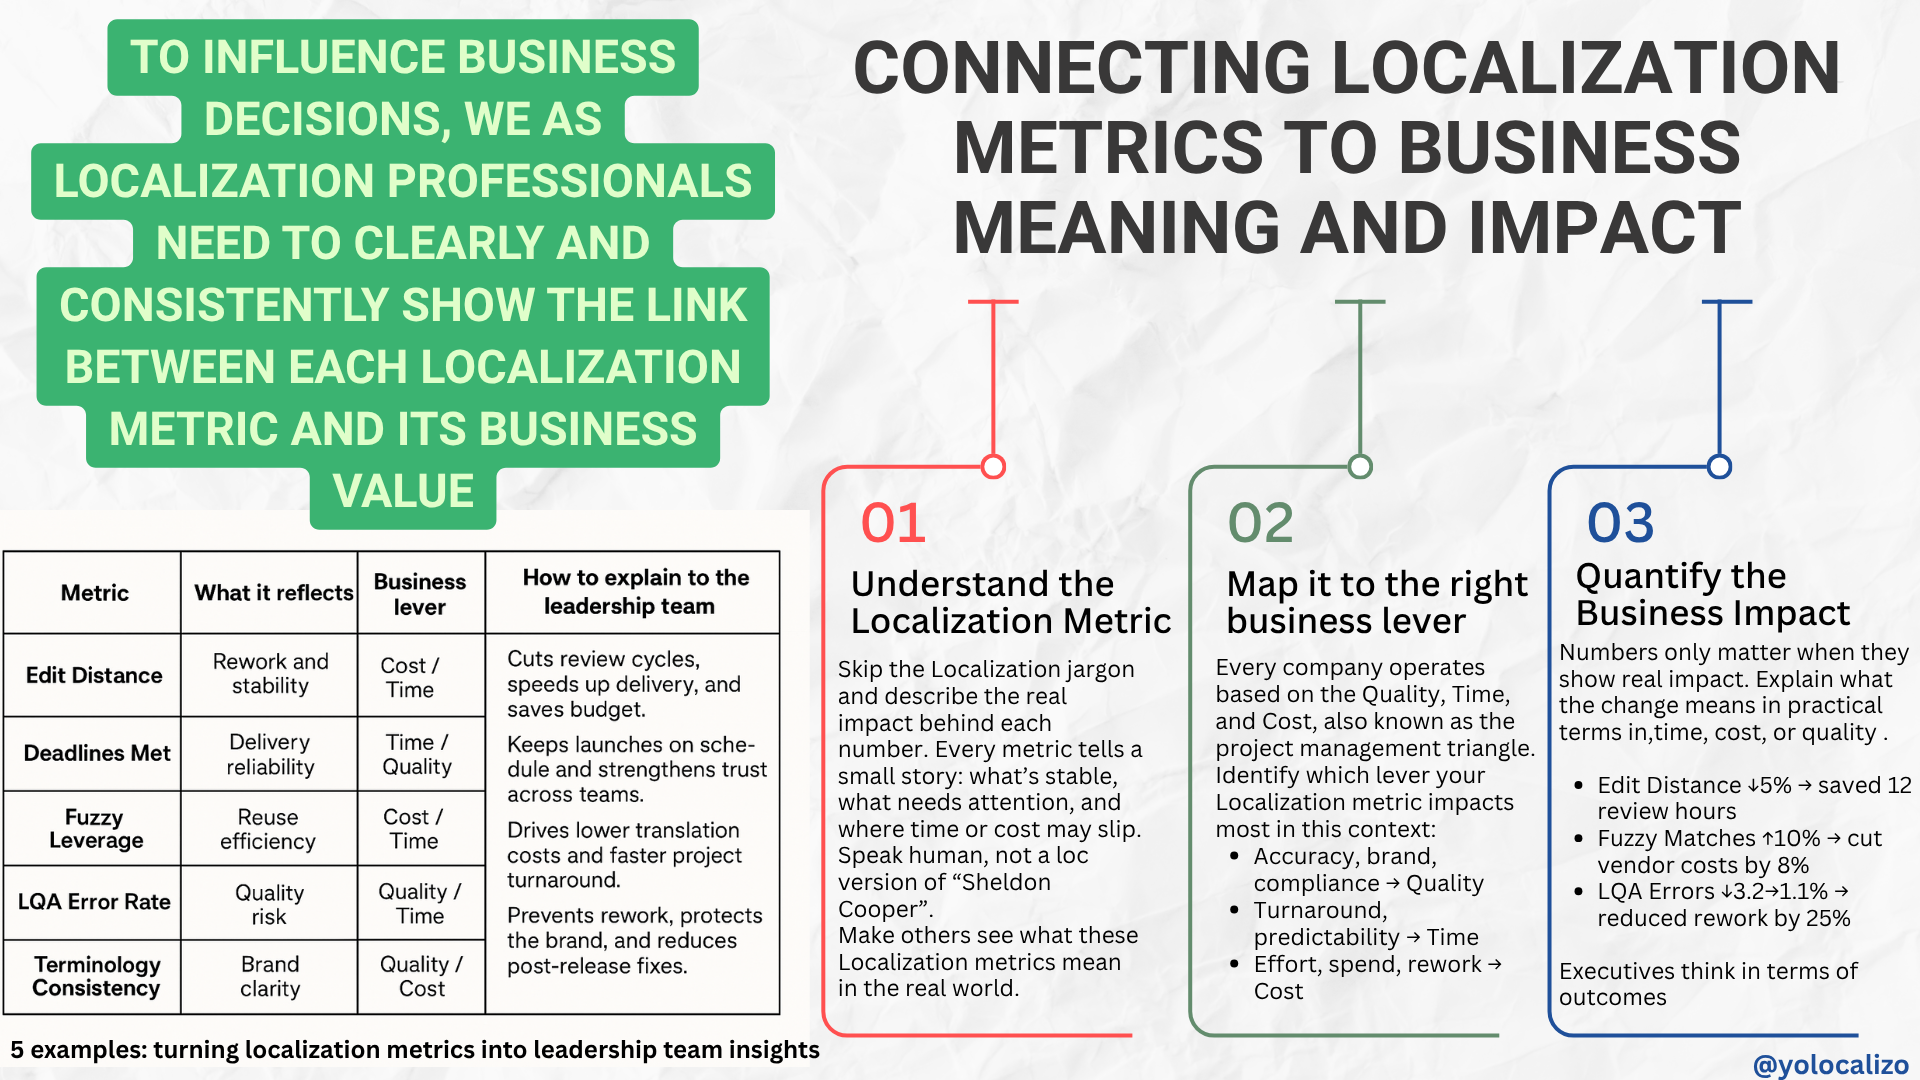
Because to influence business decisions, what we need to do as a Localization professional is clearly and consistently show the link. The link between the localization metric and business value.
In the following paragraphs, I’ll give you a method you can use with almost any metric to connect the both .
Click HERE to download the infographic
Step 1: Understand the Localization Metric
Skip the localization jargon. Describe the real work behind the number.
We love talking about our numbers: the number of cosmetic UI bugs, terminology issues, cost per word, LSP turnaround time. …We can spend hours dissecting them. But the reality is that outside our team, almost nobody cares. For a product owner or a VP, those KPIs mean little. They see them and think, “So what?”
To them, it’s background noise. It’s a bit like listening to Sheldon Cooper on The Big Bang Theory explaining quantum mechanics to his friends; he’s fascinated, they’re lost, and everyone’s just waiting for him to stop.
That’s exactly how localization metrics sound when we don’t connect them to real business meaning.
So instead of throwing numbers around, let’s pause for a second and translate them into plain language. Every metric we track tells a small story about how our work behaves in the real world, what’s running smoothly, what needs attention, and where time or money might be slipping away. When we explain them that way, people outside of localization can finally see what we see and why it matters.
The table below provides a quick overview of both sides, the operational meaning, and a hint of business relevance.
Step 2: Map it to the right business lever
Once you understand what each metric is really showing, the next step is to connect it to what the business actually values. Every company, regardless of its size and industry, operates on a few universal levers: quality, time, and cost. These are the dimensions the leadership team uses to evaluate performance, allocate budgets, and determine priorities.
Ask yourself which lever the metric moves in your specific context:
· Accuracy, brand alignment, compliance → Quality
· Turnaround, predictability, throughput → Time
· Effort, review cycles, vendor spend → Cost
You don’t need to overcomplicate this. The goal is to identify the primary lever that the metric influences most and discuss it in that context. Once you do, your localization metrics stop sounding like internal jargon and start sounding like business insights. We are starting to sound different, not like the Sheldon of the Localization industry!
Step 3 , Quantify the Business Impact
Once you’ve linked each metric to a business lever, the next step is to demonstrate scale, showing how much that movement actually matters. It’s one thing to say a process is more efficient or more predictable; it’s another to show how that change affects hours, cost, or delivery dates.
Executives don’t think in percentages; they think in outcomes. They need a sense of proportion: how big is the change, and why should they care?
For this reason, you don’t really need a detailed cost model to make the point. Even simple, directional examples bring the story to life:
· “Reducing edit distance by 5% saved about 12 review hours per 10k words.”
· “A 10% increase in fuzzy leverage cut vendor cost by around 8%.”
· “Lowering critical LQA errors from 3.2% to 1.1% reduced rework by a quarter.”
5 examples: turning localization data into executive insight
Now that we’ve walked through the three steps , understanding what each metric really shows, linking it to the right business lever, and illustrating its impact, let’s see how this looks in practice.
Below are five metrics most localization teams already track. For each one, I’ll look at what it reflects, why it matters to business leaders, and how to explain it in plain, relatable terms , no jargon Localization needed!
1) Edit distance → predictability and cost efficiency
What it captures
The gap between the first delivery and the approved final text. Larger gaps mean more post-editing and extra cycles.
Why leaders care
Rework burns time and budget. Stability shortens cycles.
How to state it
“Average edit distance dropped five points this quarter. That cut review time by about a day per 10k words and reduced vendor cost on similar projects.”
2) Deadlines met → reliability of delivery
What it captures
Whether localization lands when other teams need it.
Why leaders care
Late content block launches and creates escalations. Reliable timing lets marketing and product planning with confidence.
How to state it
“On-time delivery rose from 88% to 96%. Marketing shipped two releases without date shifts. Support volume during launch week stayed flat.”
3) Fuzzy match → reuse and cost control
What it captures
How much translation memory we reuse instead of paying for full-price new words.
Why leaders care
Reuse lowers unit cost and speeds up turnaround on repeatable content.
How to state it
“By improving 85–99% matches by ten points, we cut total project cost by roughly eight percent and finished two days earlier.”
4) LQA error rate → quality risk
What it captures
The frequency and severity of issues found during QA, especially critical ones.
Why leaders care
Critical issues lead to corrections, support tickets, and in some fields, compliance exposure.
How to state it
“Critical LQA errors fell from 3.2% to 1.1%. Documentation rework hours dropped 25% and we avoided two hotfixes.”
5) Terminology consistency → brand clarity
What it captures
Whether approved product names and terms appear the same way in the product and different communication channels
Why leaders care
Stable naming supports recognition, search, and trust. Inconsistent terms create confusion and extra support effort.
How to state it
“Terminology adherence improved in 2 markets and support tickets declined
One view for leadership
By now, the pattern (hopefully) is clear. Each localization metric tells us something about how we work, but the real value appears when we connect those signals to business outcomes. When we present our data through that lens, it stops being translation talk and begins to sound like an operational story.
Here’s a quick snapshot of what that looks like when everything comes together:
Feel free to use this table for your monthly or quarterly reviews!. Pick two metrics that moved. Explain what changed, which lever moved, and the effect on work hours, dates, or budget.
In conclusion
Back to that conversation with my peer, he didn’t need new software or a different set of KPIs. What he needed was a better story: what each metric captures, which lever it moves, and what changed in hours, dates, or money. I’m curious to see how it goes for him. Hopefully, next time we talk, he’ll tell me the meeting went well and that stakeholders are finally starting to see clearer links between the language work and the business outcomes.
@yolocalizo


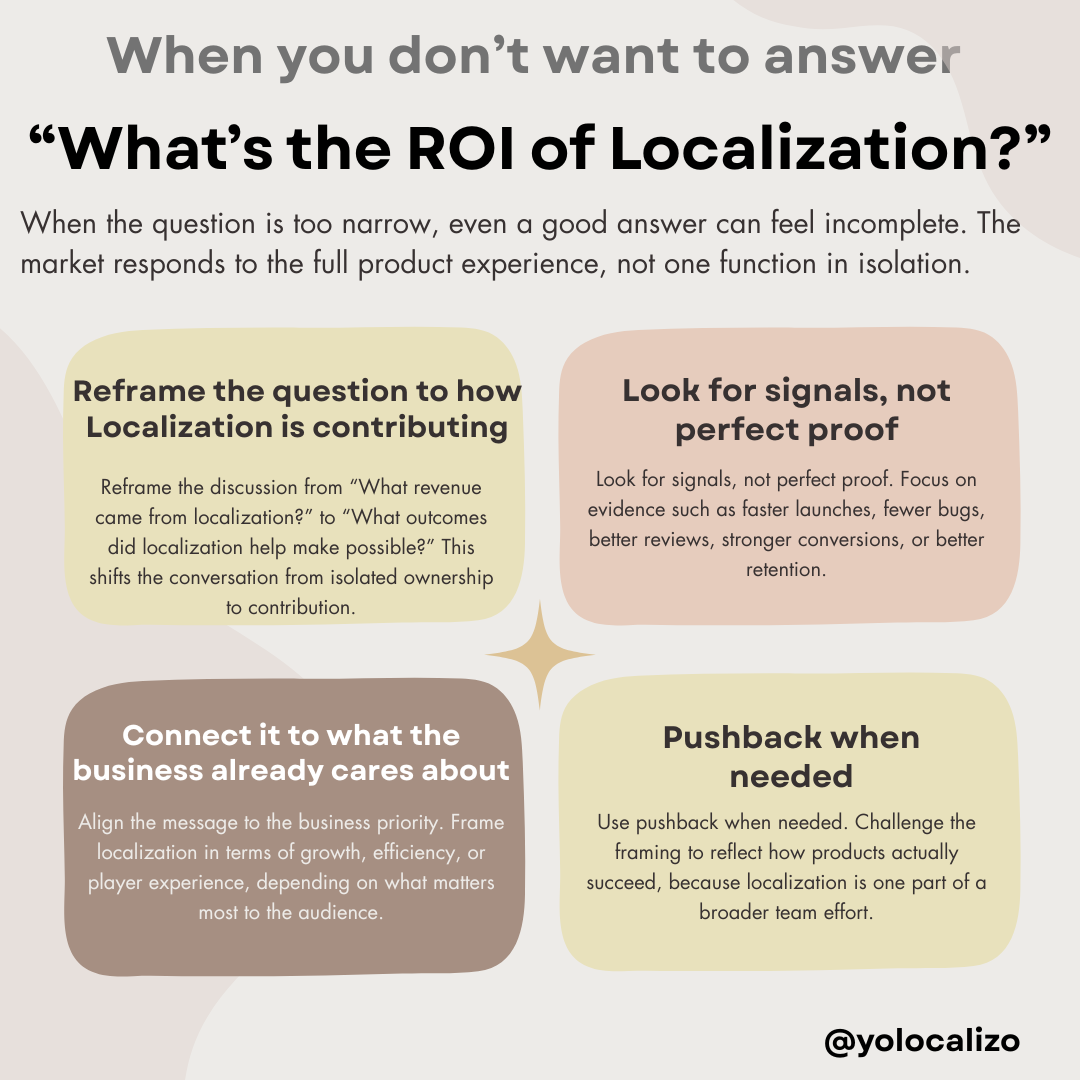
Localization Managers are often expected to keep many stakeholders happy: leadership, content teams, linguists, product teams, regional teams, finance, and procurement. But maybe happiness is not the real goal. In this post, I reflect on why stakeholder alignment matters more, and how Localization can make expectations, hidden work, ownership, and trade-offs more visible